Why are species found where they are today? Why do some places contain more species than others? These may seem like simple questions, but the answers are not straightforward.
My research examines the biogeography (where organisms occur) and biodiversity (how many organisms are present) of tropical marine fishes throughout the past 66 million years, the Cenozoic, with a particular focus on the Indo–West Pacific (IWP). I use extinct and extant specimens, spatial data, and paleoanalytic tools to investigate how organisms and their communities changed over time.
I am not a fish loyalist and often collaborate with people outside my typical scope, including those studying bats, plants, molecular data, education, and other biodiversity-related topics. Feel free to send me an email if you want to work together :)
Describing fossil lineages
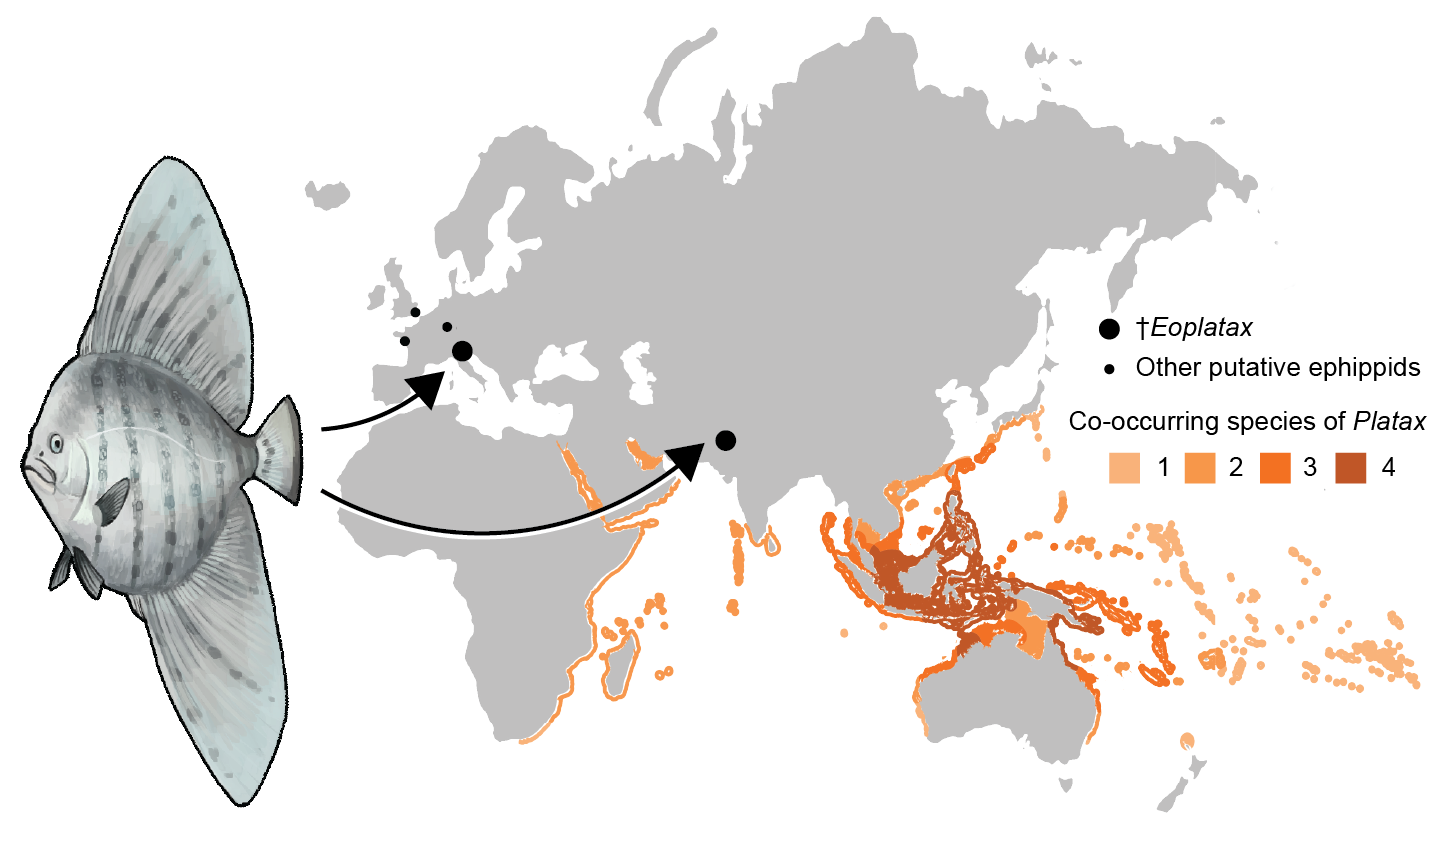
I have contributed to descriptive and taxonomic projects, particularly those focused on fossils from regions underrepresented in existing datasets. The fossils I study are typically acanthuriforms from tropical coastal environments. These specimens provide important baseline data and help reveal when and where ecological and trophic innovations emerged through time.
Documenting past ecosystems
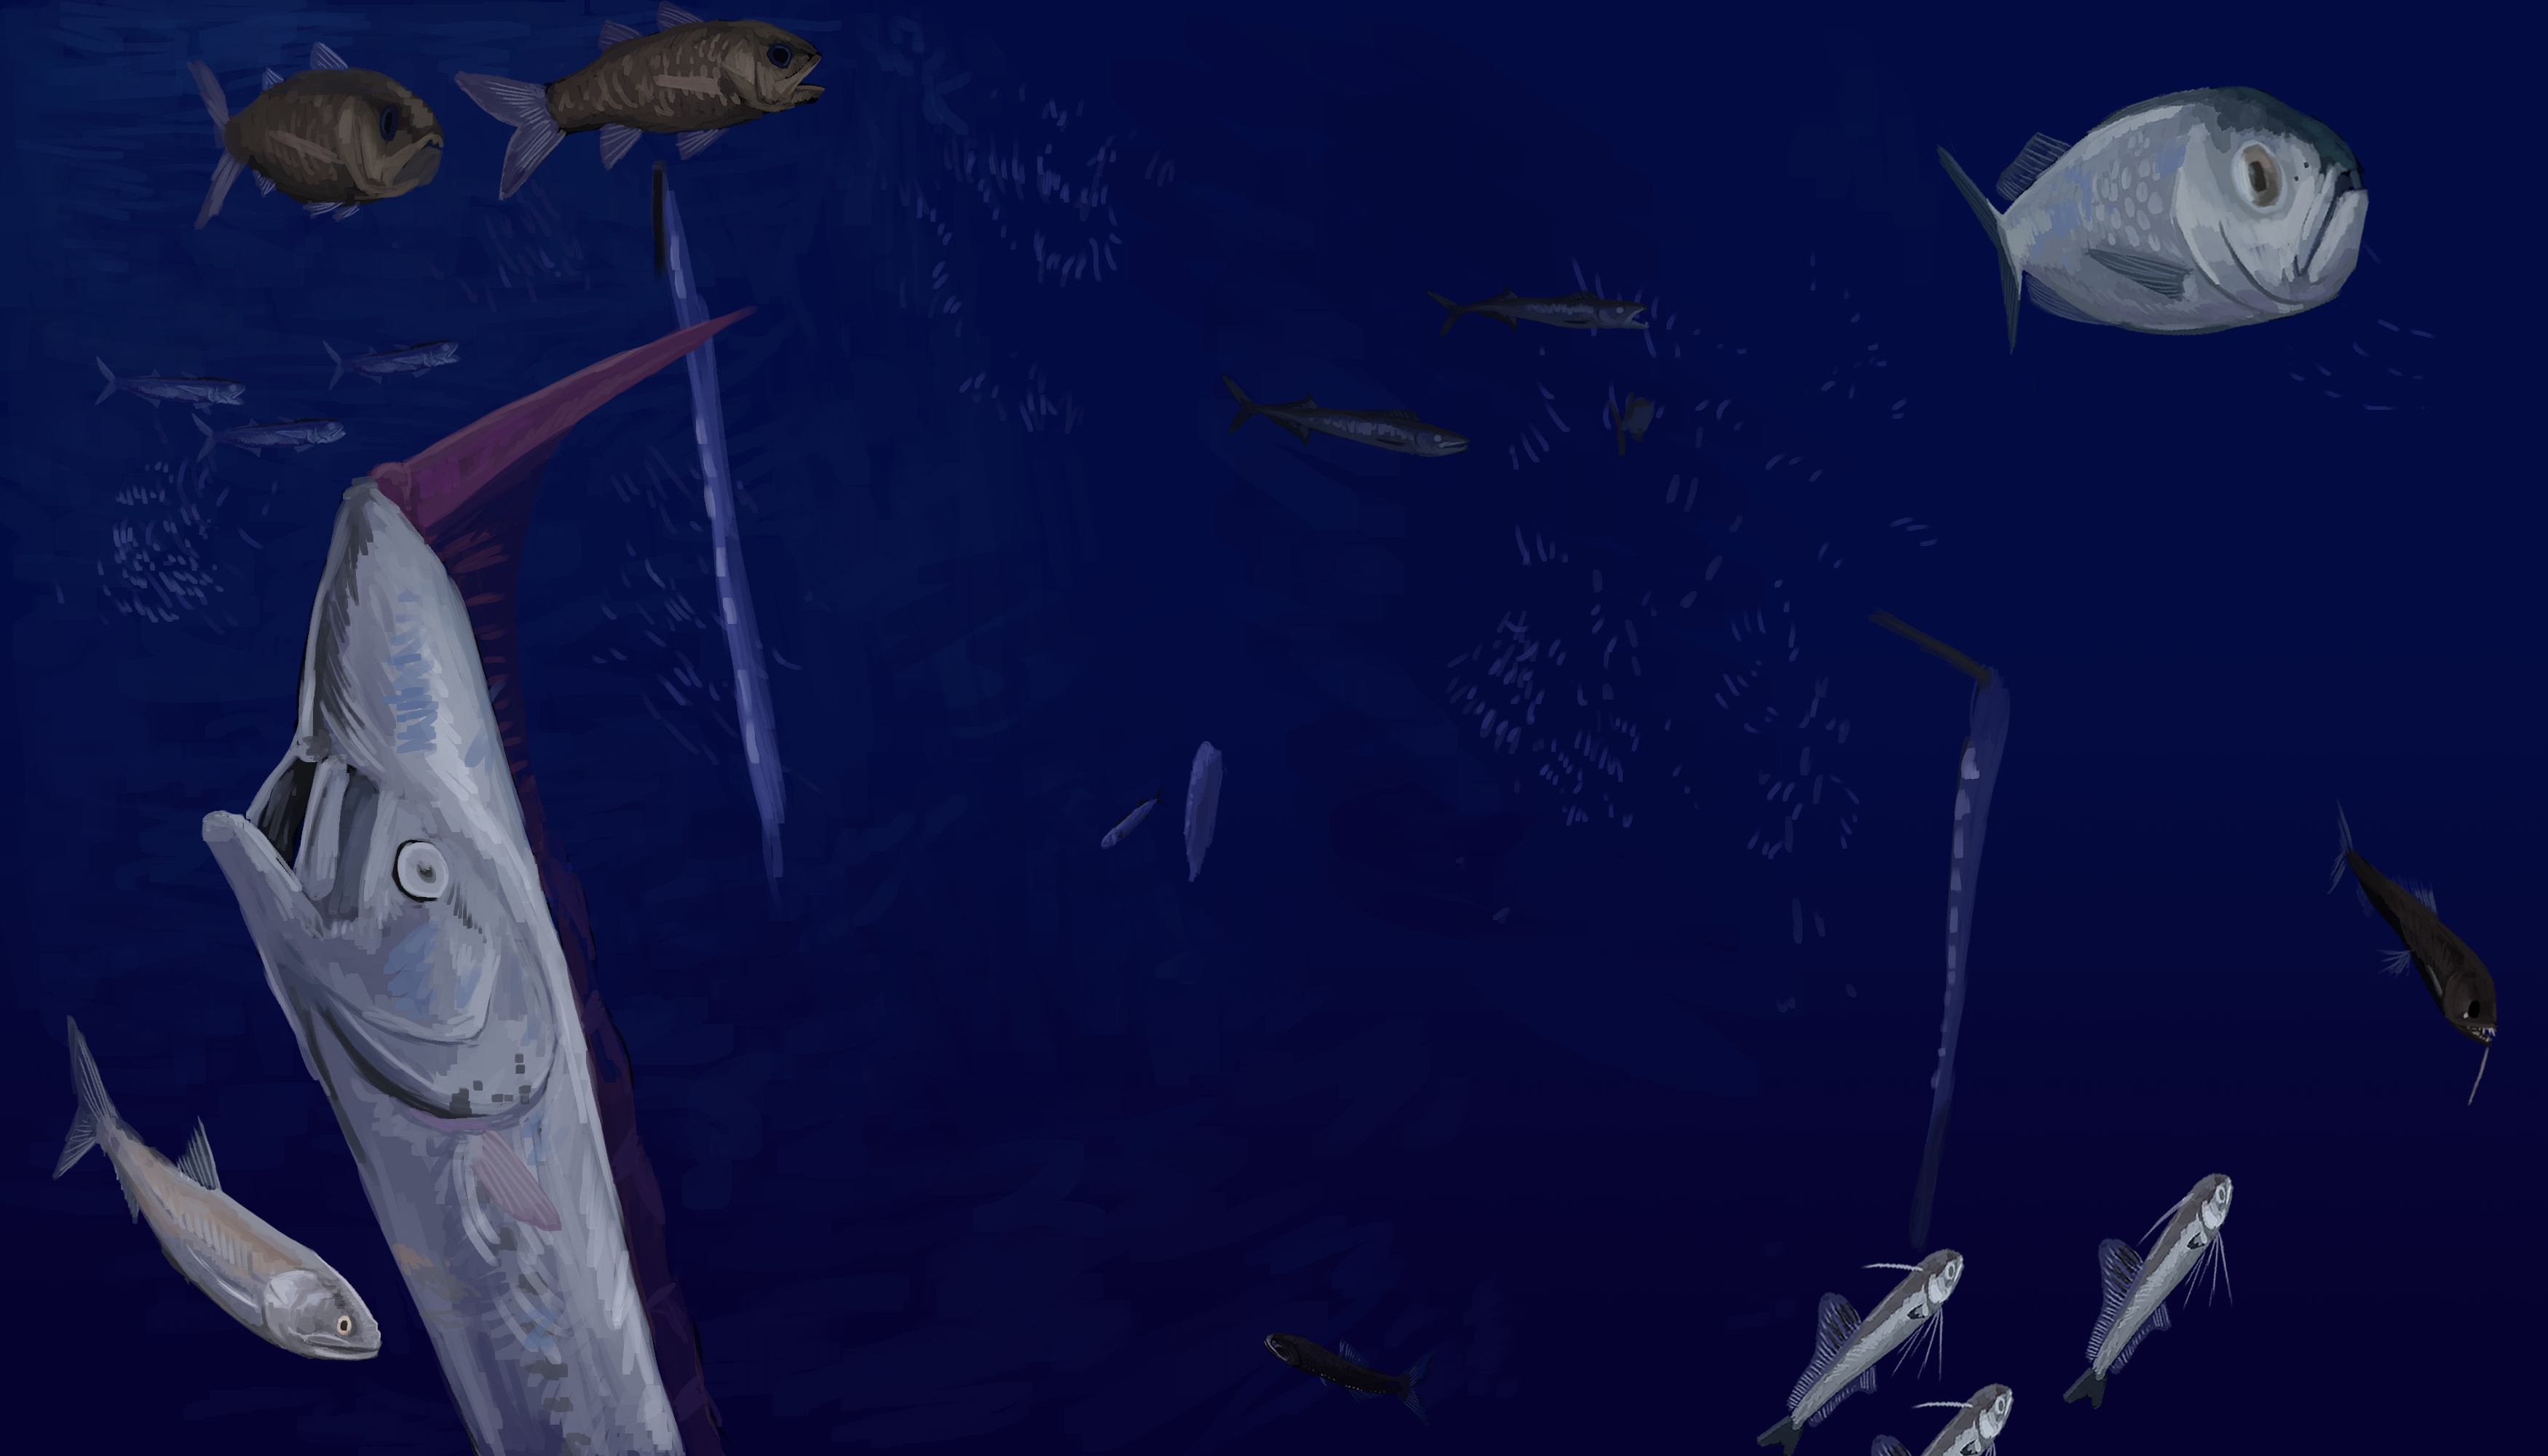
A major limitation in understanding biodiversity today is the lack of understanding how fish communities have looked since the last major extinction event. I have worked on numerous projects trying to compare fossil fish faunas. One of the ones I am currently working on compares fossil and modern fish communities across the Cenozoic, to examine the relative paleoenvironmental, paleogeographic, and stratigraphic controls on ancient fish communities in and around the IWP.
Measuring biodiversity
I am currently investigating the collapse of ancient biodiversity hotspots. To measure changes in fish diversity over deep time, I use tiny calcium carbonate structures found in the ears of fishes. I am now using different analytical methods to look at diversity through time.
The interactive map presented here was originally created for my poster at the 2024 North American Paleontological Convention. It provides a brief preview of the data I use to study fish diversity throughout the Cenozoic. The map shows otolith-bearing localities grouped by the Marine Ecoregions of the World framework (Spalding et al. 2008), with slight modifications to accommodate paleontological regions. Although the dataset is still in progress, it currently includes nearly 100,000 fossil otoliths from 80 localities spanning the Paleocene through the Miocene. You can click on each locality to learn about its depositional environment, number of unique taxa, and number of specimens. Some entries display “NA” because those portions of the dataset were not completed when I created the interactive map in 2024.